Learning Quote of the Day

Review PS1 in groups

Get into groups of three (of your own choosing) and discuss (for around 10 minutes) how you answered the questions below.

  • 3. What are five reasons why I am having you use R in this class?
  • 4. Why is copy-and-pasting results to and from Microsoft Excel and Microsoft Word, for example, not a good sustainable workflow?

R Markdown video

Review PS1 as a class

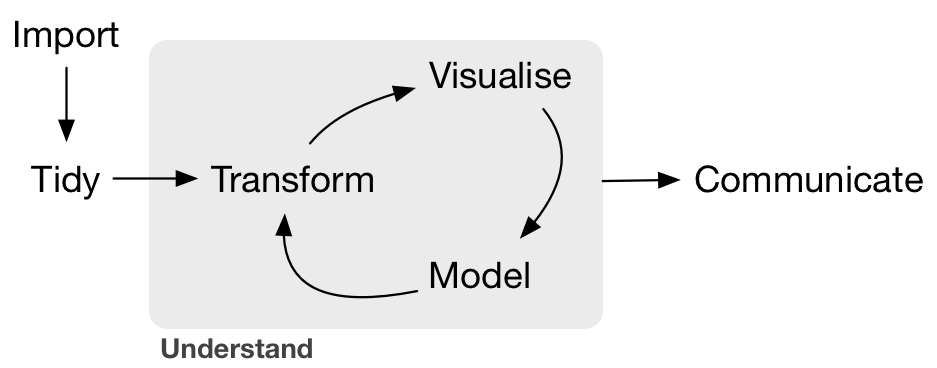
  • 5. What steps fall in the Understand section of Hadley's workflow graphic?

Review PS2 as a class

  • 6. What questions do you have about the reading or about the course?

    • I hope to always have a new PS ready for you after each class period.
    • We will almost always spend time in the beginning of class going over answers to each PS.
    • I hope to also address questions in FAQ documents here.
    • You'll have a better idea of what R is when you actually get to working with it.
    • Feel free to look ahead in the book!

Review PS2 in groups

  • 7. What concerns do you have about the course? How can I alleviate these concerns for you?

Review PS2 as a class

  • 7. What concerns do you have about the course? How can I alleviate these concerns for you?

    • You'll be given time in class on Monday to complete labs and ask questions. I'll try to have the lab assignments ready on Thursdays just as your turn in your last lab.

    • "How much outside work will be required in this class? It seems as if it will be a consistently heavy load of work."

    • I am happy to meet on a weekly basis with you as needed. I want you to like R and use it after the class is done. If you aren't enjoying the class or seeing the power of using it, I'm not doing my job well enough and we should talk about it.

My webpage http://ismayc.github.io

Interesting data sets

  • Spend some time in your groups brainstorming about a data set that you'd be interested in analyzing.
  • It doesn't have to exist and you don't all have to agree. This is also about learning about the interests of others.
  • Clearly lay out the variables and sketch what the collected data might look like.
    • What does each row correspond to?
    • What does each column?

Supplementary Material

RStudio Server

Install packages

needed_pkgs <- c("nycflights13", "dplyr", "ggplot2", "knitr", 
  "ggplot2movies", "dygraphs", "rmarkdown", "mosaic", "tibble")

new.pkgs <- needed_pkgs[!(needed_pkgs %in% installed.packages())]

if(length(new.pkgs)) {
  install.packages(new.pkgs, repos = "http://cran.rstudio.com")
}

Practice problems

  • Can eating a yogurt a day cause you to lose weight?
  • Do males find females more attractive if they wear red?
  • Does louder music cause people to drink more beer?
  • Are lions more likely to attack after a full moon?
  1. What are the variable(s) in each question?
  2. Classify them as categorical or quantitative.
  3. Draw what a tidy data set might look for each problem to collect the needed data to answer these questions.

For next time (Monday)

  • Try to finish the install of the needed packages
    • Remember that the code to install the packages is the first R chunk of code in Chapter 1 of MODERN DIVE
    • We won't actually need these packages until we start the Tidy Data chapter so if you have issues, just follow along with the Getting Used to R book.
  • The packages are all installed if you can run the R chunk you've copied again and just get > waiting for you to enter something else.

  • Read Chapters 3, 4, and 5 of Getting Used to R

  • We will be walking through many of the examples there and also doing some Plicker questions to check your understanding of variables and observational units.

Minute Papers

  • What did you learn about in class today? What questions do you have?

  • What additional concerns do you have? I understand they likely might not all be gone, but I'm always interested in how you think your learning is going.